Visualizing customers’ emotions
Sales & Marketing - Radical product improvement through state of the art data-visualization.
«The Visual Agency team embraced our vision to visualize emotion as data and brought their innovative concepts to life. They quickly and efficiently distilled a complicated concept in a way that has democratized access to our insights platform and will help to fuel growth for BRANDthrō.»
Explore the project
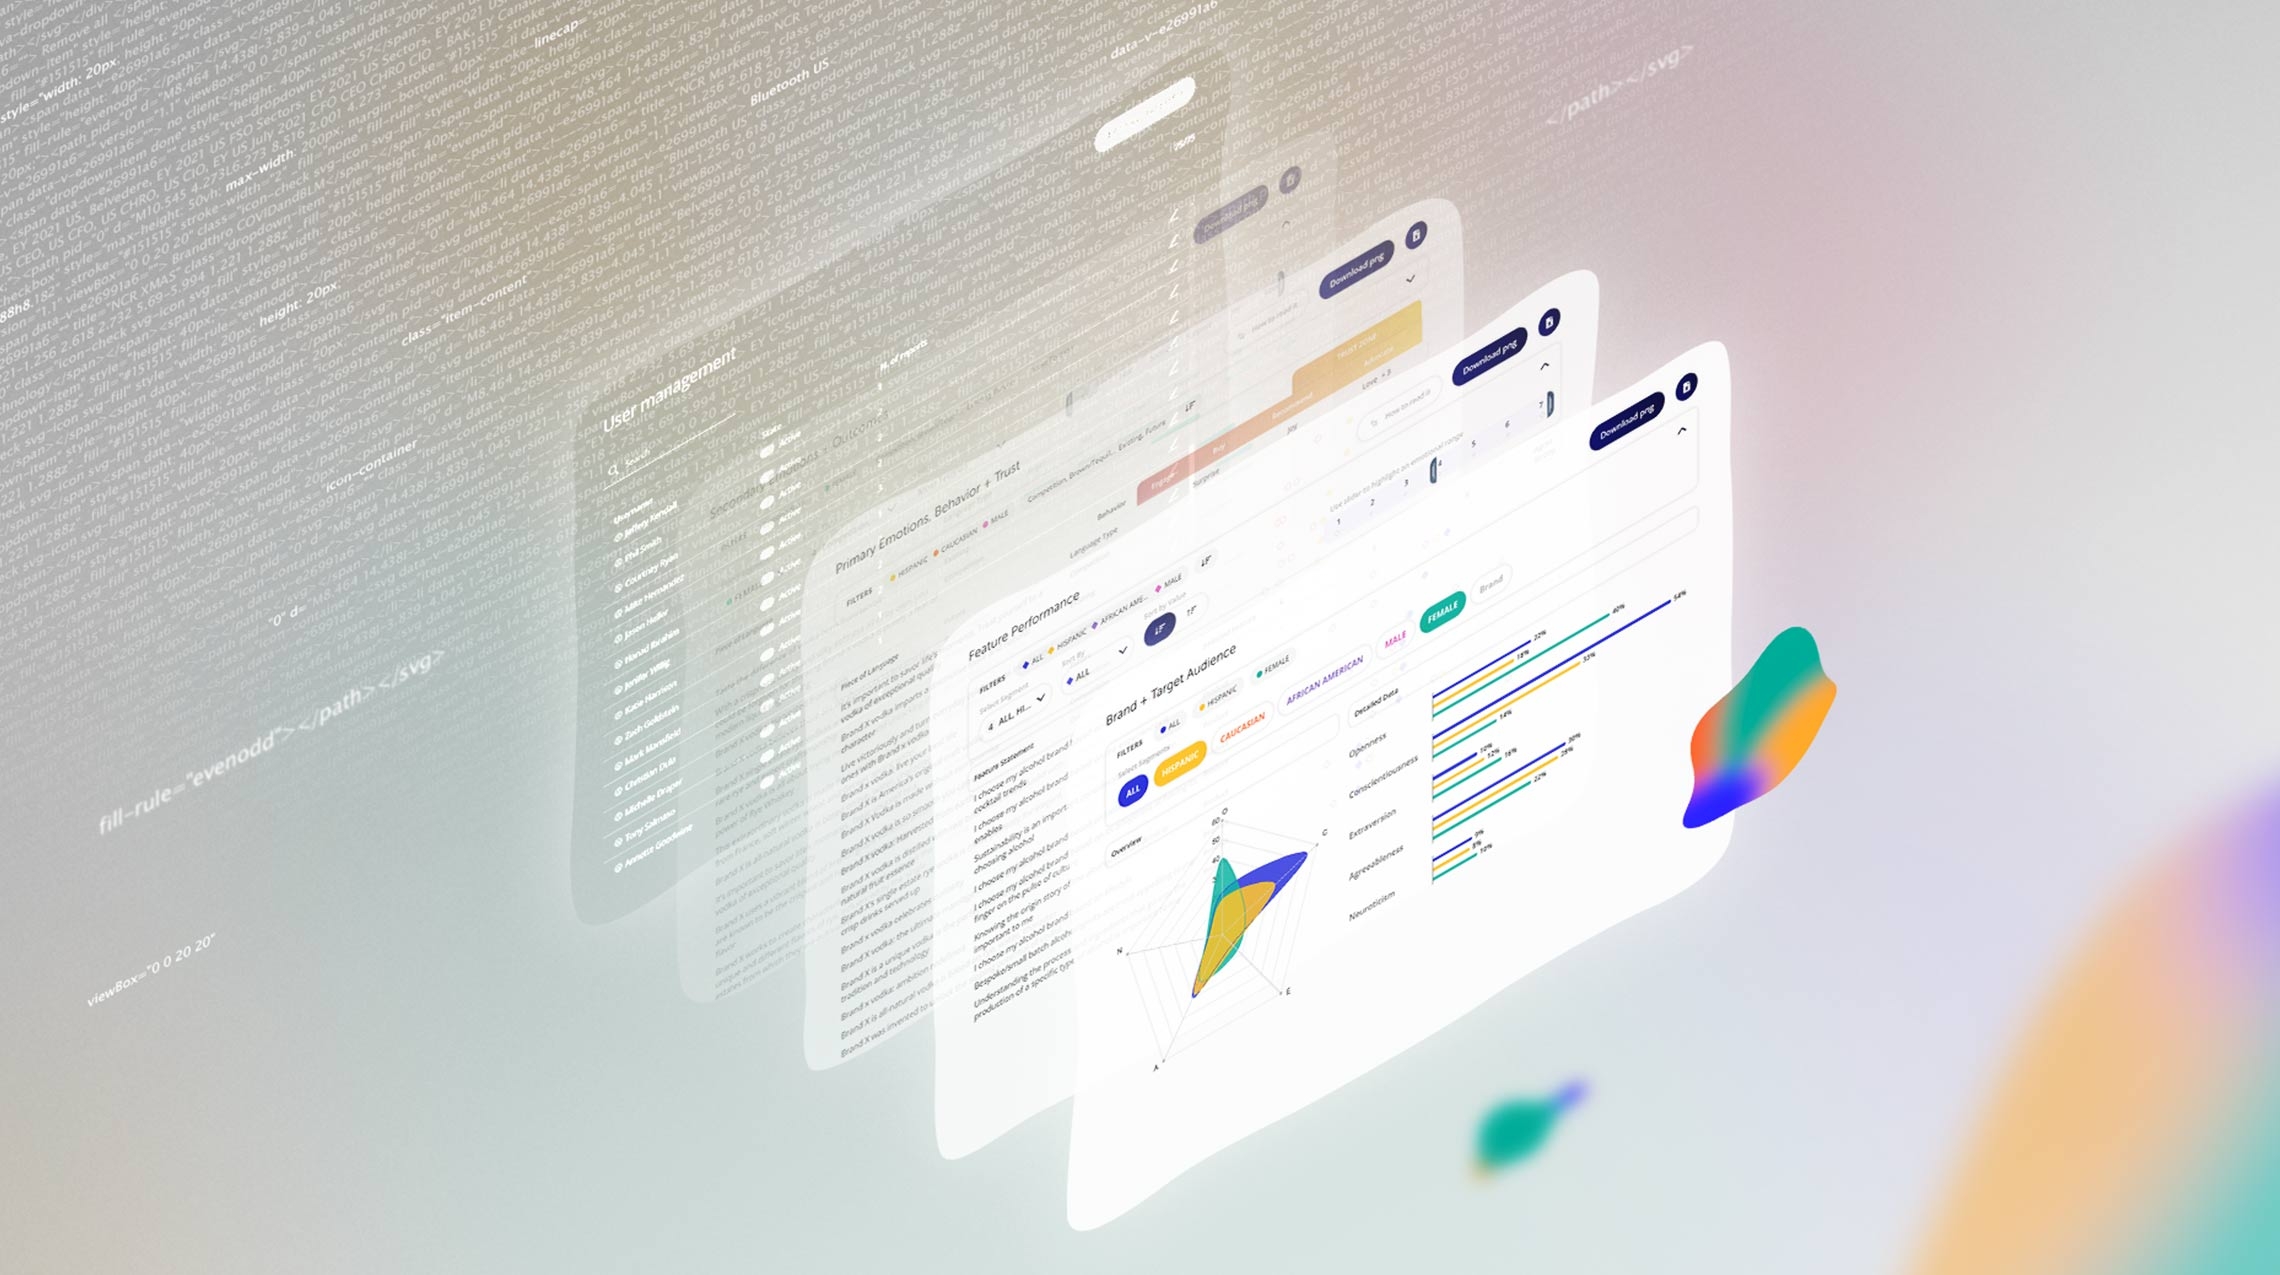
ePR (Emotional Profile Report), the platform designed for Brandthrō, automatically transforms static reports into interactive data visualizations, optimizing insights and end-customer user experience.
Surveys lead to two types of ‘Commercial Intimacy Insights’: audience development and emotional linguistic analysis.
From 100 static pages to 4 interactive chapters
The data generated by the surveys was once manually analyzed and statically visualized. Now, it is transformed into a digital tool organized in 4 main chapters, each with a visual identity represented by a geometric shape:
- Personality analysis
- Brand features
- Emotions
- Authenticity + Tension
The data represented in each section can be filtered by the demographic characteristics of the respondents.
Audience development
Information obtained from the surveys is added to existing user profiling segments to paint a more intimate and in-depth picture of the target audience.
This provides a comprehensive understanding of the target audience's characteristics and habitual behavior which enables the end client to precisely identify those customers that are primed for acquisition.
Big 5 OCEAN Model
Thanks to the personality lens applied to the data, it is possible to get a clearer picture of the target. This is done comparing the habits and characteristics of the target with those of the reference brand.
The model used is that of the Big 5 OCEAN:
- Openness
- Conscientiousness
- Extraversion
- Agreeableness
- Neuroticism
Brand features analysis
In addition to analyzing consumers, BRANDthrō also analyzes brand features, ranking the different components of the brand experience based on emotional intensity.
These insights are then matched to target audiences to identify the brand experiences which perform best. This approach identifies the likelihood of customer acquisition or retention and through the visualization of emotional insights supports the client driving customer permissioning.
Emotional Linguistic Analysis
The brand's tone of voice, language, and lexical register are mapped into primary and secondary emotions. The emotional continuum is represented on a scale ranging from -3 (Anger) to + 3 (Love).
For each phrase analyzed, the algorithm determines a result:
- Affect: the consumer's primary emotional response determines their attitude toward the product.
- Authenticity: the secondary emotions allow to determine the authenticity of the responses and what is the level of tension.
The obtained insights, visualized through a state-of-the-art design approach help clients to improve product innovation, build a more authentic corporate culture and ignite trust, loyalty and spend amongst the end-customers.
Managing and monitoring
All reports are hosted in a custom content repository to which BRANDthrō's clients have direct access elevating the product from a third party tool to an integrated instrument into the client’s daily operating habits.
To regulate access to the site and content, a management portal was created. On this portal it is possible to decide which content each user can access, so that they do not have access to sensitive and confidential information.
